[includeme file=”infofeed_menu.html”]
[threecol_one]
How do I know if a source is scholarly?
Articles published in scholarly journals are written for a scholarly audience. Often you may be required to use scholarly articles exclusively. Therefore, it is important that you be able to distinguish between scholarly articles and other types of articles.
Some general characteristics are:
[unordered_list style=”arrow”]
- Original research is reported
- Specialized knowledge is required and/or assumed
- Specialized vocabulary (jargon) and concepts are used without explanation or definition
- Pictures are usually not included, and are only used in an informative context
- Advertisements are not included
- Bibliographies / Works Cited are included
- In-text citations / footnotes / endnotes are used
Scholarly sources are describing original research performed by the author/s, not reporting on research done by others.
Scholarly sources are written by scholars to be read by other scholars. It is assumed that a reader will be an expert or specialist in the field.
It is assumed that a reader will be an expert or specialist in the field; if they don’t already know a term or concept, they should know how to find (and learn) more.
Unless they are essential to the content being discussed, pictures are not included (exceptions are art journals and medical journals). Charts, graphs, and tables are commonly the only images found in scholarly sources, and are used to illustrate a concept and/or to present data.
Scholarly publications (especially journals) are funded through subscriptions, not advertisements
If a source does not contain a bibliography / works cited, chances are it is not a scholarly source.
Statements and statistics are always cited. As a reader, you should be able to use the in-text citations / footnotes / endnotes to check the accuracy and authority of the research.
[/unordered_list]
When/Why do I use a scholarly source?
[unordered_list style=”arrow”]
- When you need a source that covers your material in depth.
- When you need a good source for background information.
- When you are researching in the humanities.
- When you need a source for qualitative research
- When you need research from an expert.
- When you need information on a very specific topic.
- When you need a source for the physical sciences.
- When you need a source for quantitative research
- When you need scholarly analysis
Scholarly books are in-depth works with a unifying topic.
Scholarly books don’t have page limits–the author/s can provide excellent background information.
Scholarly books are the most important type of source for Literature, Philosophy, Art, etc.
Scholarly books are the most important type of source for qualitative studies in the social sciences (Sociology, Political Science, Anthropology, etc.)
Scholarly books and articles clearly display the credentials and affiliations of all authors.
Scholarly articles are narrowly focused on one small aspect of an academic subject or discipline.
Scholarly articles are the most important type of source for the physical sciences (Biology, Chemistry, Physics, etc.)
Scholarly articles are the most important type of source for quantitative studies in the social sciences (Sociology, Political Science, Anthropology, etc.)
Scholarly books and articles are the only sources of scholarly analysis.
[/unordered_list]
[/threecol_one]
[threecol_two_last]
Test: Scholarly
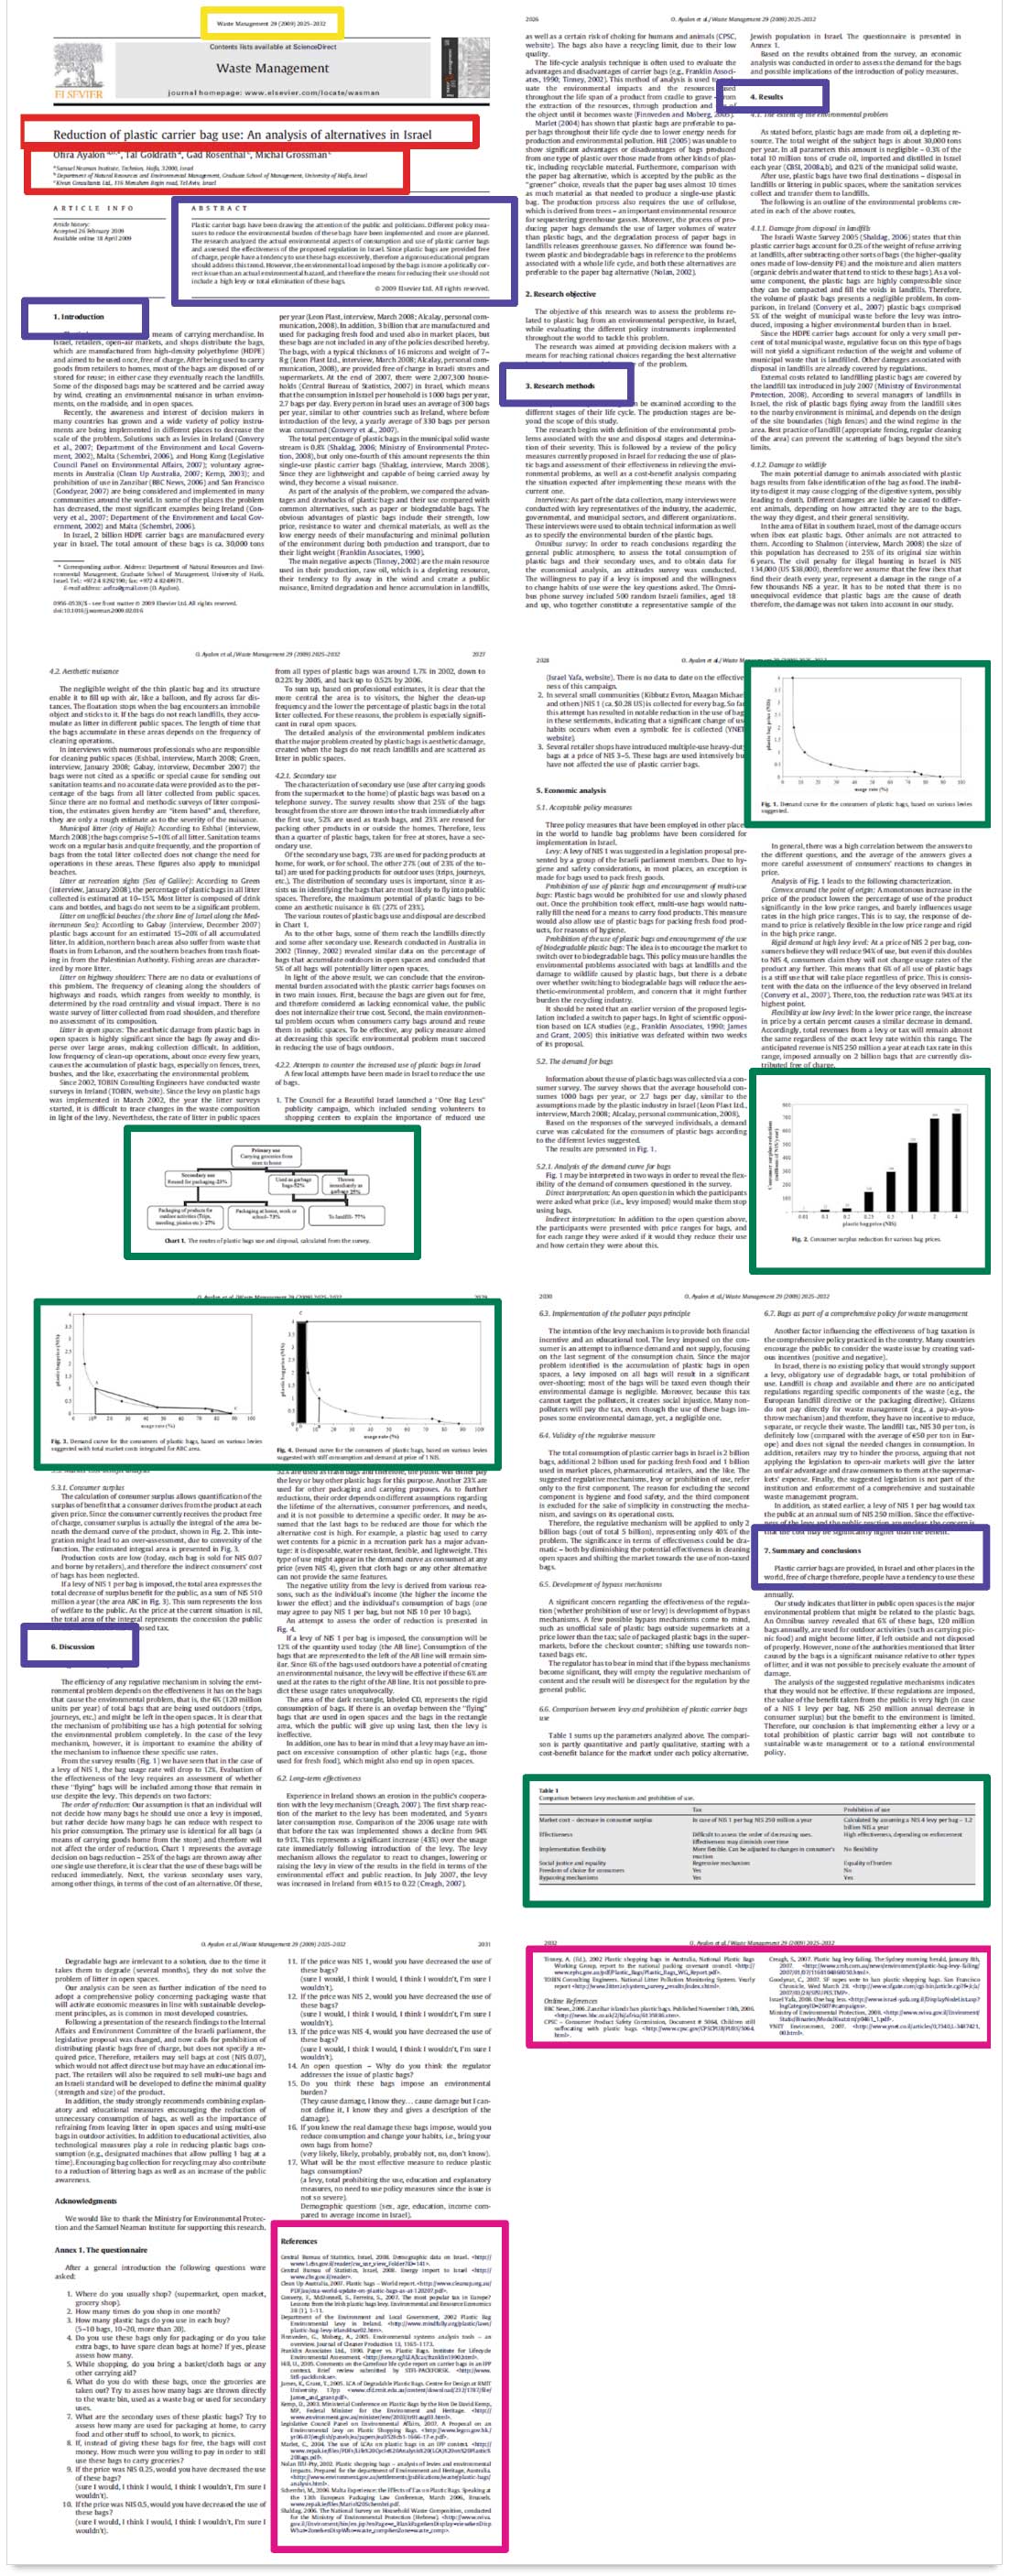
Explore the image below — mouseover the targets to learn more about the anatomy of a scholarly article. This example uses a scholarly article, but the elements discussed also apply to scholarly books.
Ayalon, Ofira, et al. "Reduction of Plastic Carrier Bag Use: An Analysis of Alternatives in Israel." Waste Management New York, N.Y. 29.7 (2009): 2025-32. ScienceDirect. Web. 18 January 2013.

CITATION
On the first page of a scholarly article you will find the journal title, the volume/issue numbers, and page numbers. You will need all of this information to properly cite the article in your paper. This information may be found at the top or bottom of the first page.
On the first page of a scholarly article you will find the journal title, the volume/issue numbers, and page numbers. You will need all of this information to properly cite the article in your paper. This information may be found at the top or bottom of the first page.

In this section data is presented, and often illustrated in charts, graphs, and/or tables. Scholarly sources use images (usually of charts, data, and/or graphs) to present findings, and to enhance the argument presented.
*Tip: Images are not included simply to make a source look more readable. You may find charts, graphs, and/or tables, but you won't find glossy pictures.' type="text">
In this section data is presented, and often illustrated in charts, graphs, and/or tables. Scholarly sources use images (usually of charts, data, and/or graphs) to present findings, and to enhance the argument presented.
*Tip: Images are not included simply to make a source look more readable. You may find charts, graphs, and/or tables, but you won't find glossy pictures.' type="text">RESULTS
Sometimes called findings, this section is where the author/s present the raw data they've collected.
In this section data is presented, and often illustrated in charts, graphs, and/or tables. Scholarly sources use images (usually of charts, data, and/or graphs) to present findings, and to enhance the argument presented.
*Tip: Images are not included simply to make a source look more readable. You may find charts, graphs, and/or tables, but you won't find glossy pictures.' type="text">
In this section data is presented, and often illustrated in charts, graphs, and/or tables. Scholarly sources use images (usually of charts, data, and/or graphs) to present findings, and to enhance the argument presented.
*Tip: Images are not included simply to make a source look more readable. You may find charts, graphs, and/or tables, but you won't find glossy pictures.' type="text">RESULTS
Sometimes called findings, this section is where the author/s present the raw data they've collected.
In this section data is presented, and often illustrated in charts, graphs, and/or tables. Scholarly sources use images (usually of charts, data, and/or graphs) to present findings, and to enhance the argument presented.
*Tip: Images are not included simply to make a source look more readable. You may find charts, graphs, and/or tables, but you won't find glossy pictures.

TITLE
Most titles are descriptive enough to provide a sense of the article's content and style. If technical vocabulary is used in the title, you can expect to see it used in the article.
Most titles are descriptive enough to provide a sense of the article's content and style. If technical vocabulary is used in the title, you can expect to see it used in the article.
AUTHORS
A scholarly article will display author names and credentials. Credentials are proof that other experts in the fields recognize an author as a peer.
Educational credentials have differing degrees of value. A PhD is a sign of more expertise than a Master's degree. Except for a few fields in which a Master's degree is the terminal (highest) degree, most authoritative scholars have a PhD.
ABSTRACT
The abstract is always found at the beginning of an article. It provides a summary of the article, including a description of the main points and important findings.
After reading the abstract you should know the article's objective, how the research was done (methodology), what the authors found (results), and why this research contributes to the field.
INTRODUCTION The first section of most scholarly articles is the introduction. Here you will find the research question or thesis, a description of the topic or argument, and discussion of the scope of the research project.
The literature review may incorporated into the introduction, or it may be a stand-alone section following the introduction.
The literature review may incorporated into the introduction, or it may be a stand-alone section following the introduction.
RESEARCH METHODS
This section (sometimes called methodology, or methods and materials) describes exactly how the author/s performed the research.
A good methodology section will be detailed enough that another researcher could perform the same study in order to test the results.
In addition to the research methods and tools used to collect the data presented, you should also find a explanation of why these methods and tools were chosen over others. Often you will find that the limitations of the methods and tools are also discussed.

GRAPHS
The purpose of a scholarly article is to contribute to a particular field of research. One way to demonstrate that research is original and notable is to present data or findings. The data should be complete, and the tables, graphs, and/or charts should be related to the research and support the findings.
*Tip: Tables, graphs, charts, and equations are common in scholarly sources and can help you to distinguish between scholarly and popular articles.
GRAPHS
The purpose of a scholarly article is to contribute to a particular field of research. One way to demonstrate that research is original and notable is to present data or findings.
The data should be complete, and the tables, graphs, and/or charts should be related to the research and support the findings.
*Tip: Tables, graphs, charts, and equations are common in scholarly sources and can help you to distinguish between scholarly and popular articles.
CHARTS
The purpose of a scholarly article is to contribute to a particular field of research. One way to demonstrate that research is original and notable is to present data or findings.
The data should be complete, and the tables, graphs, and/or charts should be related to the research and support the findings.
*Tip: Tables, graphs, charts, and equations are common in scholarly sources and can help you to distinguish between scholarly and popular articles.
GRAPHS
The purpose of a scholarly article is to contribute to a particular field of research. One way to demonstrate that research is original and notable is to present data or findings.
The data should be complete, and the tables, graphs, and/or charts should be related to the research and support the findings.
*Tip: Tables, graphs, charts, and equations are common in scholarly sources and can help you to distinguish between scholarly and popular articles.
The purpose of a scholarly article is to contribute to a particular field of research. One way to demonstrate that research is original and notable is to present data or findings.
The data should be complete, and the tables, graphs, and/or charts should be related to the research and support the findings.
*Tip: Tables, graphs, charts, and equations are common in scholarly sources and can help you to distinguish between scholarly and popular articles.
CONCLUSION
This is the final section of a scholarly article. In this (often short) section you will find a summary of the results, a (short) discussion of why the results are important, and recommendations for further research.
This is the final section of a scholarly article. In this (often short) section you will find a summary of the results, a (short) discussion of why the results are important, and recommendations for further research.
DISCUSSION
In this section, the author/s analyze the findings (data), clarify any limitations of the study, and explain its importance.
Reading this section (along with the abstract and introduction) will give you a good sense of how useful the source may be in your own research.
In this section, the author/s analyze the findings (data), clarify any limitations of the study, and explain its importance.
Reading this section (along with the abstract and introduction) will give you a good sense of how useful the source may be in your own research.
TABLES
The purpose of a scholarly article is to contribute to a particular field of research. One way to demonstrate that research is original and notable is to present data or findings.
The data should be complete, and the tables, graphs, and/or charts should be related to the research and support the findings.
*Tip: Tables, graphs, charts, and equations are common in scholarly sources and can help you to distinguish between scholarly and popular articles.

REFERENCES
This section may also be titled "Works Cited" or "Bibliography." This list, at the end of a scholarly article, provides citations for every source used or quoted in the article. Each reference corresponds to a book, article, website, dataset, or other source mentioned in the body of the article.
If an article relates to your topic, you can use this list to find other, similar sources.
*Tip: If an article doesn't have a References list, it probably can't be considered scholarly.